
Hello Geeks..!!! Thanks for your love and support. I will be starting this series just to provide little bit of background on monitoring tool as its one of the key aspects within infrastructure and modern application deployments failure scenarios.
With this let’s get started…
I will be covering here continuous monitoring tool – Nagios. Continuous monitoring is a process to detect, report, respond all the attacks which occur in its infrastructure. Once the application is deployed into the server, the role of continuous monitoring comes in to play. The entire process is all about taking care of the company’s infrastructure and respond appropriately. There are many other monitoring tools like Splunk , Prometheus , ELK , Liborto , Sensu etc which I will cover later in this series.
Nagios is an open-source software for continuous monitoring of systems , networks and infrastructure which works on client server architecture. It runs plugins stored on a server which are connected with hosts. In case of any failures, it alerts about the issues and technical team can perform recovery operations immediately and reduce downtime.
History
This tool was developed by Ethan galstad in year 1999 as part of Netsaint distribution. In 2002 , it was renamed as Nagios because of trademark issues with the name “Netsaint”. Nagios releases its first commercial version “Nagios X1” in year 2009. This project was again renamed as “Nagios Core”.
Features of Nagios
- Good logging mechanism and database system.
- Informative and attractive web interface.
- Automatically sends email alerts if any conditions change within Infrastructure.
- It helps in detecting and monitor network services like https , snmp , ftp etc and server crashes.
Nagios Architecture
Nagios is a client-server architecture. Within network , a nagios server is running on host or virtual machine and plugins are installed on all remote system which are required under monitoring umbrella.
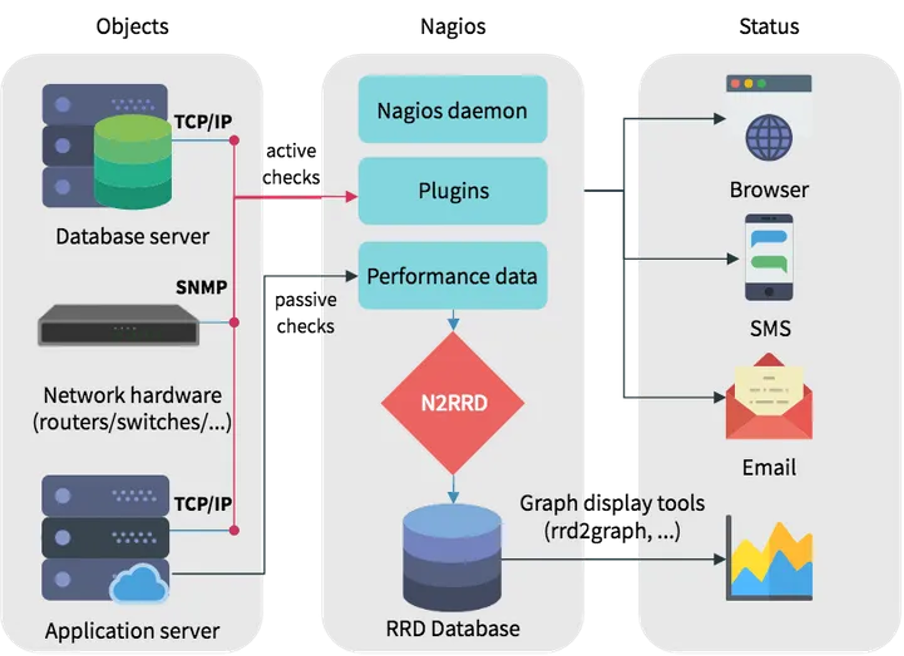
Let’s discuss how it works in background..
- Create configuration files consist of IP’s / username/password and parameters required for host monitoring.
- Daemon read those details from the configuration files and look for which data need to be collected.
- Daemon uses NRPE plugin i.e Nagios remote plugin executer to collect data from the nodes and stress within database. To help NRPE plugin , each node installed with something called NRPE agents.
- It uses port numbers 5666 , 5667 and 5668 to monitor it clients.
- Finally , shows everything on database.
Let’s consider quick example of plugin work
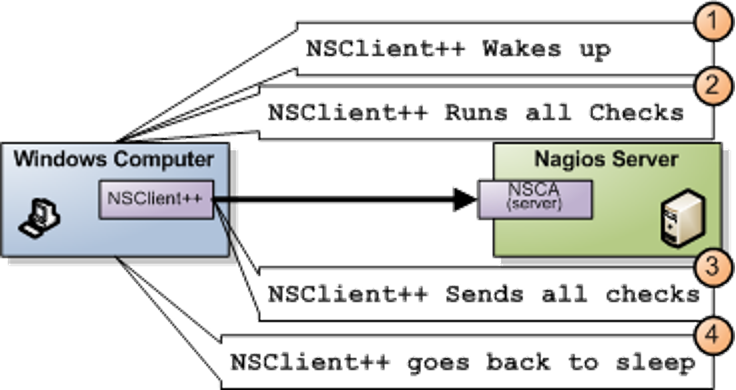
- Check_nt is a plugin to monitor a windows machine which is mostly available in the monitoring server
- NSClinet++ should be installed in every Windows machine that you wants to monitor
- There is an SSL connection between the server and the host which continuously exchange information with each other
- Likewise, NRPE(Nagios Remote plug-in Executor) and NSCA plugins are used to monitor Linux and Mac OS X respectively.
That all for now. In next post , I will setup the Nagios and show demo.