
Welcome back to CloudTechs Club!
I’m excited to kick off a brand-new series focused entirely on monitoring in DevOps, where we take a hands-on, real-world approach to tools like Prometheus, Grafana, and Nagios.
This series is designed to walk you through foundational concepts all the way to advanced implementations — helping you build a complete and practical monitoring setup as part of your DevOps journey.
Today, we’ll dive into an Introduction to Prometheus and Grafana, two of the most powerful and widely adopted monitoring tools in the ecosystem.
🧭 What is Prometheus?
Prometheus is an open-source monitoring and alerting tool designed to help you keep track of your infrastructure and applications.
It can monitor:
- Servers (CPU, memory, disk, network usage, etc.)
- Network devices (via SNMP exporter)
- Batch jobs (via PushGateway)
To collect these metrics, Prometheus uses exporters:
- Node Exporter: Acts as an agent installed on each system to collect system-level metrics like CPU, memory, and disk usage.
- SNMP Exporter: Collects statistics from network devices using the SNMP protocol.
Prometheus uses a pull-based model, meaning it connects to each exporter and pulls metrics at regular intervals.
🏗 Prometheus Architecture Explained
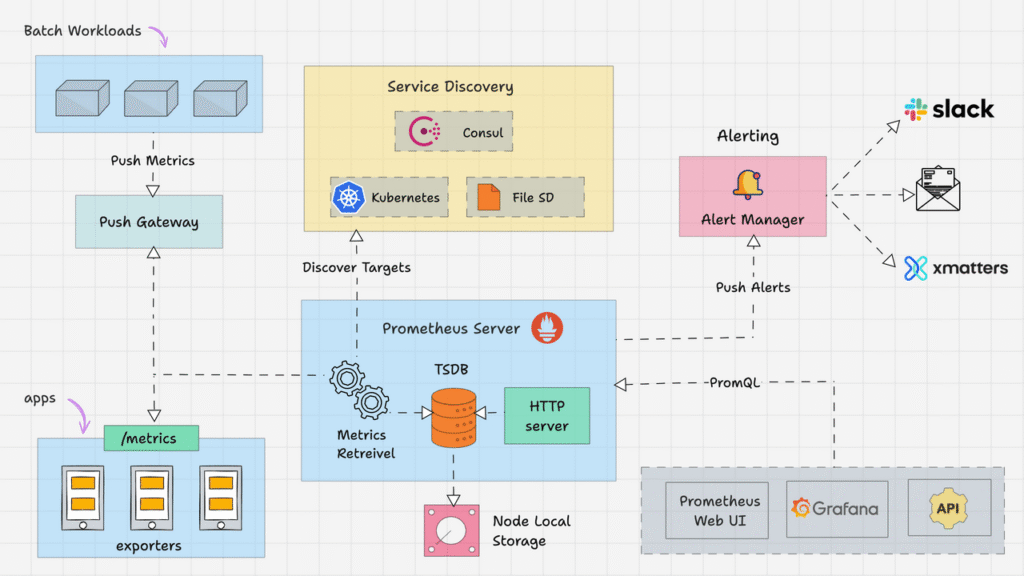
Prometheus is built around three main components:
1. Retrieval Component
This is responsible for collecting metrics from targets using HTTP.
2. TSDB (Time Series Database)
All collected metrics are stored in Prometheus’s built-in Time Series Database. Unlike traditional databases, TSDB stores data over time — perfect for monitoring trends, performance spikes, and resource usage history.
3. HTTP Server
Prometheus includes a web interface that allows you to view metrics, run queries, and troubleshoot issues — all through your browser.
🔍 Querying Data with PromQL
Prometheus uses its own query language called PromQL (Prometheus Query Language). Think of it as a powerful search tool that lets you ask questions like:
- “What was the CPU usage on server X in the past 1 hour?”
- “What’s the current memory usage across all servers?”
PromQL powers:
- The Prometheus Web UI
- Grafana dashboards
- API clients or custom tools that need access to metrics
📢 Alerting with Prometheus and Alertmanager
Yes, Prometheus supports alerting!
But it doesn’t send alerts on its own. Instead, it uses a component called Alertmanager.
Here’s how it works:
- Prometheus checks metrics against defined alerting rules
- If a rule condition is met (e.g., CPU > 90%), it sends an alert to Alertmanager
- Alertmanager routes the alert to appropriate destinations like:
- PagerDuty
- Telegram
- And many more
Alert rules are defined in the Prometheus configuration file. We’ll cover how to write those during the hands-on session.
🛰 Service Discovery vs Static Configuration
How does Prometheus know what to monitor?
🔧 Static Configuration
You manually list server IPs or hostnames in the config file. Works well for small, static environments.
⚙️ Service Discovery
In dynamic environments (like AWS, Kubernetes, or containers), Prometheus can automatically detect new systems or services using built-in service discovery integrations.
This ensures you’re always monitoring the right targets — even as your environment scales.
⚡ TSDB and Storage Performance
Prometheus stores all metrics locally on the same server where it runs. Because it reads and writes a lot of data, it’s recommended to use fast storage, such as:
- SSD
- NVMe drives
These significantly improve performance when querying historical data or handling high-frequency metrics.
🧩 Summary: Key Features of Prometheus
Here are some of the core features that make Prometheus a top choice for monitoring:
- Stores metrics in key-value pairs in a Time Series Database
- Uses PromQL for flexible, powerful querying
- Operates on a pull-based model over HTTP
- Supports static configuration and service discovery
- Integrates seamlessly with tools like Grafana
- Supports alerting through Alertmanager
- Offers multiple visualization options: Grafana, custom apps, and API access
🚀 Coming Up Next: Installing Prometheus on a Linux System
Now that you have a solid understanding of what Prometheus is, how it works, and its core components — it’s time to get our hands dirty.
In the next section, we’ll walk through a step-by-step guide to installing Prometheus on a Linux system.
You’ll learn how to:
- Set up the Prometheus user and necessary directories
- Download and configure the Prometheus binary
- Set up the service to run Prometheus in the background
- Access the Prometheus web interface and start monitoring
Stay tuned — we’re about to bring your monitoring setup to life!